Updated January 6, 2011
Real estate market in Toronto experienced just a short period of low activity and soft prices at the end of 2008 and beginning of 2009. The sales gained pace in the spring of 2009, and that year ended with a 17 percent increase in the number of sold properties from 2008.
It was expected that the introduction of Toronto Land Transfer Tax will put a damper on the real estate activity, and it is possible that without it the sales would have been even stronger. 2009 was also a year of low inventories, and that caused bidding wars, especially in the central districts. Low interest rates and increased consumer confidence caused previously hesitant buyers to start an active search for a new residence.
Market conditions in Toronto real estate changed in 2010 from a frantic pace in the first 4 months to a substantially slower sales in the summer, and then back to a good activity in the fall. Comparing to 2009,
one percent fewer
listings were sold in 2010. The sales activity experienced in the fall seems sustainable over a longer term.
The average real estate price in Toronto increased by nine percent, to $431,463. We hope that an increase in real estate listings in the spring will sustain balanced market conditions which would result in 2011 price increases in a moderate five percent range.
There are several factors at play that affect our real estate market.
-
The interest rates remain still at their historical low, lowering the real cost of purchasing a house, townhouse, condo apartment or loft, at least for the length of the mortgage term. The recent increases have neither dampened the activity down in any significant way, nor remarkably reduced affordability.
-
Economic conditions improved over the last year, and
-
Young people, immigrants, and foreign investors are fuelling the demand, while older generation stays longer in their homes.
The province imposed a freeze on urban boundary expansions, which means that land prices are bound to increase. Increased land values lead to an increase in property prices. Increases in single family development charges in the City of Toronto will increase the cost of newly constructed housing, which is already suffering from the higher materials and energy costs. New Toronto Land Transfer Tax was introduced in 2009, and Harmonized Sales Tax came into effect in July of last year. The later does not have a great impact on purchases of resale homes, other than adding to the closing costs, but will be felt by buyers of new construction.
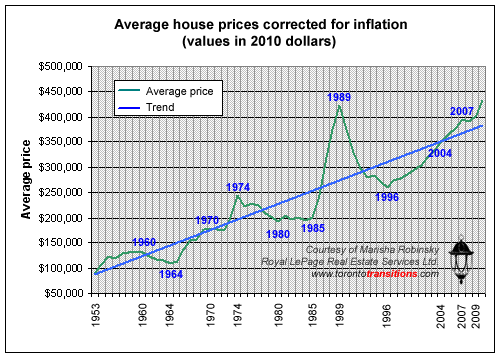
Real estate remains a sound investment. In the last almost 15 years, since the end of March 1996 (the lowest point in the recent years) the average value of a house in Toronto rose by approximately 118 percent. In contrast, the increase in average house price in just 5 years between 1984 and 1989 was an astonishing 168 percent. Houses were often re-sold several times, each time selling for a higher price. Such frenzied market had to burn itself out. If we take into account inflation, average house prices increased only 2% from the 1989 level.
Using average house prices on record since 1953, corrected for inflation (for comparison purposes we brought the historical data up to today's equivalent values), we produced the following graph. The average prices are courtesy of TREB.
As you may see on the graph, during this time span there were two significant 'spikes' in house prices, and three 'dips'. Blue line denotes the trend. Each time the average prices rose above the trend line a 'correction' ensued. We can see that correction on the graph below as a result of late 2008 and early 2009 market conditions.

At the beginning of 2004, when the average house price reached $315,231 (which, corrected for inflation amounts to $350,754, the price line has crossed over the trend line. But the increase rate was moderate. The recent brief correction was more of levelling off the prices, similar to the period between 1957 and 1960. After that brief correction the prices continued to rise, and the increases were quite substantial during the first four months of 2010. That pace slowed down later in the year, to end with nine percent year-over-year increase.
When the prices rise faster than the trend suggests, the market eventually slows down. Whether the prices become stable, following the trend line, or actually drop, seems to depend on the speed with which the price increases happen. The steeper the angle of the curve representing house prices, the more likely is a price 'correction'.
Price increases since 1996 were much more gradual that in the period between 1985 and 1989, and follow a much gentler curve than the ones leading to the past two peaks of 1974 and 1989. Although the angle of the average price line is steeper now than it has been since 1996, it is still gentler than during these two peaks that led to the 'bubble burst'.


